Strategic planning is a necessity for every firm to succeed. Because of this, The Boston Consulting Group created the BCG Matrix (growth-share matrix or product portfolio matrix) to assist businesses with long-term strategy planning. A corporation with a wide portfolio should routinely evaluate its product lines to determine which ones are lucrative, which ones are incurring losses, and which ones require improvement.
“We keep speed in mind with each new product we release…. And we continue to work on making it all go even faster…. We’re always looking for new places where we can make a difference.”
Google’s company-philosophy statement
Has the matrix lost its usefulness in light of the market’s current rapid and unexpected rate of change?
No, quite the opposite! However, its significance has evolved; in order to allow adaptation to a more uncertain corporate environment, it now needs to be implemented more quickly and with a higher emphasis on strategic experimentation.
| Content |
| What is BCG Matrix? |
| The four quadrant grid |
| How to construct the BCG matrix? |
| Suggestions for strategic positioning |
| Advantages & Limitations of BCG matrix |
| Final Thoughts |
What is BCG Matrix?
Growth/Share Matrix, otherwise called BCG matrix, is a critical framework used by Boston Consulting Group to investigate development opportunities by examining its item or product portfolio to decide where to invest, to discontinue or develop things.
The BCG model essentially sees the company as a portfolio of businesses, each of which makes a distinct contribution to growth and profitability. These mostly autonomous units have distinct strategic goals that can be addressed.
The four quadrant grid
BCG’s growth-share matrix plots each business on a four-quadrant grid. In order to measure a firm’s level of competitiveness, the horizontal axis represents the company’s market share in comparison to its main rival.
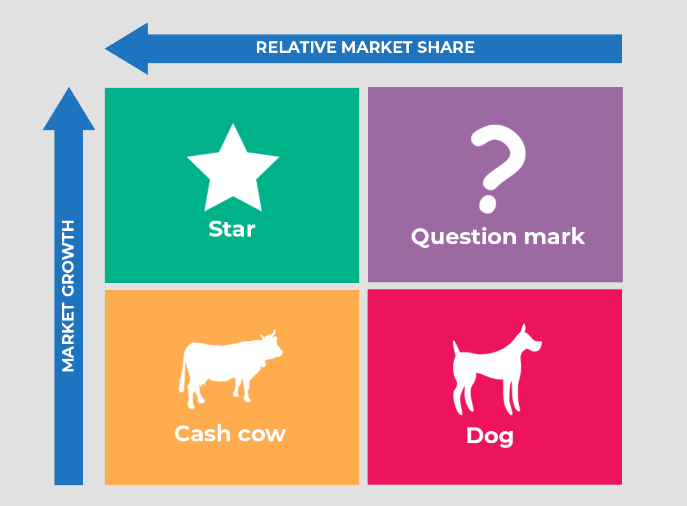
The vertical axis shows the market growth percentage or market attractiveness of the business. Each firm is represented by a circle, with the area inside each circle corresponding to total sales.
There are three benefits to using the growth-share matrix.
- The visual representation presents a clear and concise image of the strengths of the businesses in the firm’s portfolio.
- It identifies each company’s ability to earn cash and also indicates its financial requirements.
- It can offer strategic recommendations by highlighting the strategic direction of each business unit.
How to construct the BCG matrix?
STEP 1: Select & decide the product
The BCG matrix can be used to evaluate business units, distinct brands, products, or an enterprise as a whole. The unit selection has an impact on the entire analysis. Consequently, it is required to define the unit.
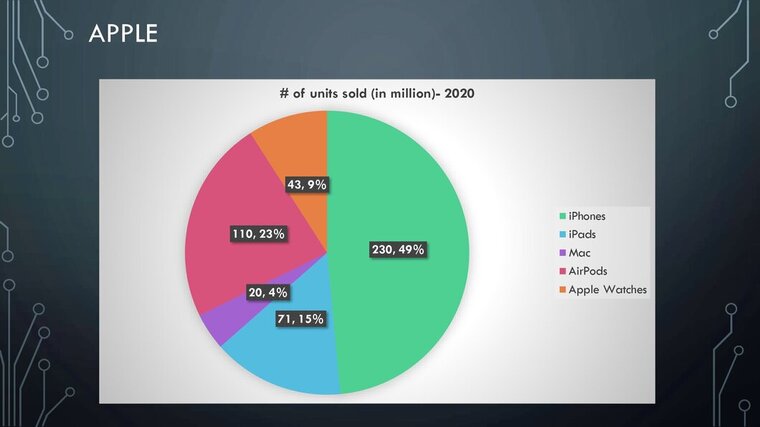
Consider the Apple BCG matrix, for instance. We examine Apple’s business segments and overall growth to facilitate a better understanding.
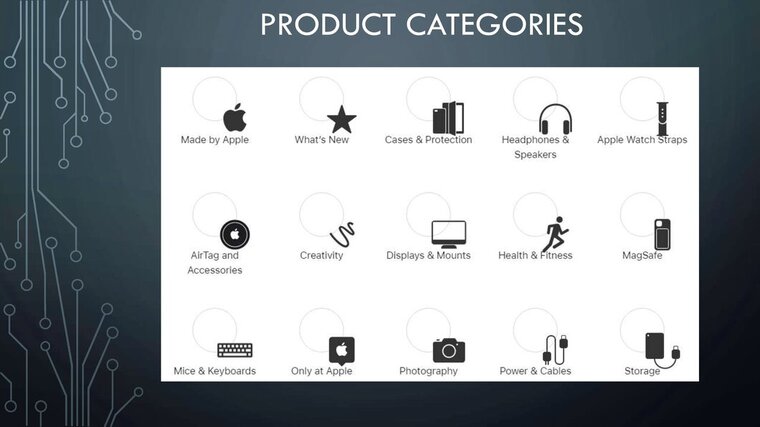
Apple Inc. designs, develops, and sells smartphones, laptops, tablets, wearables, and accessories. It also offers a range of connected services. iPhone, Mac, iPad, wearable technology, home goods, and accessories are among the company’s offerings. The company’s iPhone range of smartphones runs on the iOS platform.
With the iPhone, one of the most well-known and important brands in the world, Apple helped launch the smartphone revolution. Apple was able to introduce new product categories, like the iPad, because to the iPhone’s popularity. Apple envisioned the tablet as a device that could function as both a laptop and a smartphone.
STEP 2: Define the market
Incorrectly defining a market can lead to poor product classifications. No company, especially a small one, can serve all customers’ needs. It’s best to define your target market as precisely as possible. Even the largest businesses must engage in this process of niche creation to succeed.
For instance, if we were to analyze the Apple I-phone brand for the general market, we would find that it is a dog (it has less than 20% of the related market), but in the niche market sector, it is a cash cow.
In our case, the consumer electronics industry is selected as the defined market, which primarily consists of Apple watches, iPads, iPhones, and Mac computers.
STEP 3: Measuring the Internal Strength of the Business
Relative market share is used to determine a business’s internal strength. Relative market share is defined as follows:

There is no percentage used to denote relative market share. It provides a comparison of the company’s sales to those of its most significant rivals. For instance, a relative market share of 2 indicates that company sales are twice as high as those of the main rival. The growth-share matrix displays each company’s relative market share on a semi-log scale (x-axis).
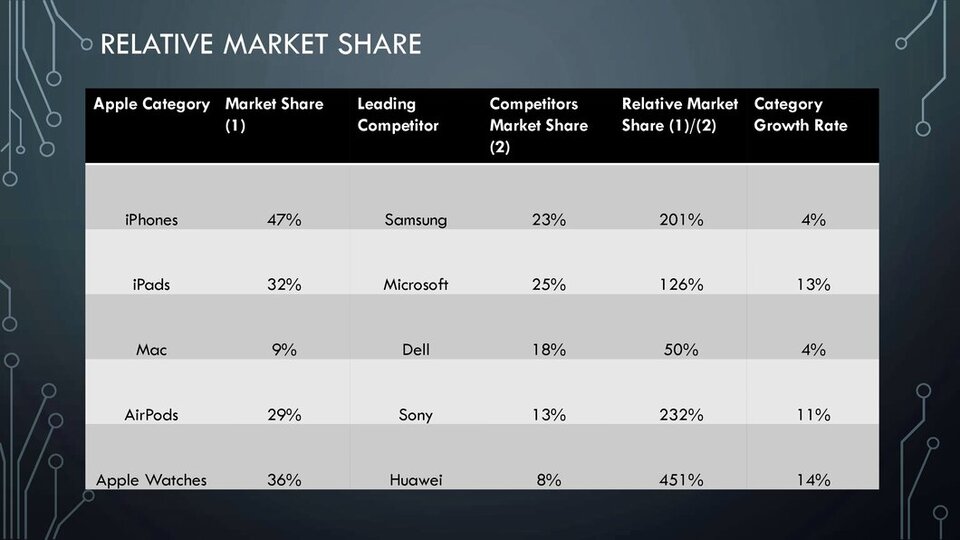
A cut-off point must be created according to the growth-share matrix to distinguish between companies with strong and weak internal strength. BCG decided on a cut-off value of 1.0 relative market share.
STEP 4: Measuring the Attractiveness of the Market
For each of the firm’s businesses, the market-growth rate, which is represented on the matrix’s vertical axis, is used as a sign for the market’s attractiveness.
The market growth rate is measured as below.

This indicator provides a measure of the industry’s attractiveness without taking into account the position of a specific firm. There are many opportunities for all businesses to succeed in markets with strong growth because the overall market share available is growing in these markets.
Overall Growth rate in Consumer Electronics Industry (as of 2022) = 9.3%
STEP 5: Measuring the Contribution of Each Business to the Firm
The growth-share matrix uses a third parameter—the business’s contribution to the firm’s portfolio as measured in sales—in addition to situating its companies in terms of industry attractiveness and competitive strength. The matrix’s circle’s inside region serves as a representation of it.
Sales is selected as a metric for contribution because it makes it simple to compare portfolios of rival companies and offers a useful way to assess the relative strengths and weaknesses of all businesses operating in the same sector.
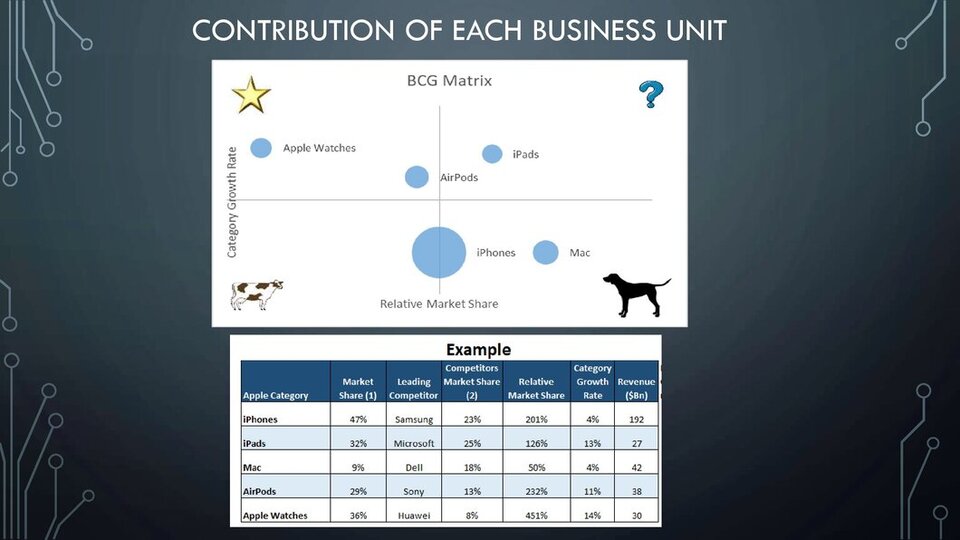
The relative market share is shown on the x-axis, and the industry growth rate is shown on the y-axis. For each unit, brand, or product, you can draw a circle whose size, ideally, reflects the percentage of sales it brings in.
STEP 6: Cash-Flow Implications of the Growth-Share Matrix
The growth-share matrix’s simplicity is a significant aspect. It uses just three indications in a graphical representation to attempt to convey the complexity of a firm’s portfolio. This classification of a firm’s businesses has a number of effects, the most significant of which relates to the flow of cash across businesses.
To visualize cash flow transactions, the same growth-share matrix can be expressed in terms of cash-use and cash-generation.
The business portfolio of the company is separated into four quadrants. Additionally, the companies in each quadrant distinguish out in terms of cash flow, and they may be identified by terms that have become as popular jargon: “dogs” “question marks” “stars” and “cash cows“.
Stars
The companies in the matrix’s upper-left corner are known as the Stars. They have strong competitive positions and are very attractive firms (those with rapid market growth) (high relative market share). As a result of their success, they make a lot of cash, but they also need a lot of money to maintain their competitive edge in their quickly expanding markets. The amount of cash either provided to or demanded from the company is therefore minimal.
These stars eventually develop into cash cows with huge market shares in a market with slow growth as the market ages. These cows are milked to pay for other innovative products that create new stars.
Strategic Choices: Vertical integration, Horizontal integration, market penetration, market development, product development
Cash Cows
These companies (shown in the matrix’s lower left corner) represent the organization’s cash sources. They make more revenue than they should because of their exceptionally strong competitive power in falling markets.
As a result, they serve as funding sources for expanding other businesses inside the company. The decision to allocate resources inside a company must ultimately be made at the managerial level.
Strategic Choices: Product development, diversification
Question Marks
Major unexplored prospects exist in the upper right quadrant of the chart, and the Question Marks are particularly alluring due to their rapid market expansion. However, they haven’t been able to capture large market shares.
Before investing the requisite sizeable sums of money in them, it is important to identify the companies among them that may be effectively elevated to a leading position. However, due to their small market position, bad investments could still degrade them to Dogs even after significant investment.
Strategic Choices: Market penetration, market development, product development, divestiture
Dogs
These companies (in the lower right quadrant) are unmistakably the biggest losers and the weakest. They are “cash traps” because the meagre revenue they produce is required to fund their ongoing operations.
The appropriate course of action would be divesting if there is no good reason to anticipate a turnaround in the near future. These products have cost disadvantages as a result of their small market share.
Strategic Choices: Retrenchment, divestiture, liquidation
Suggestions for Strategic Positioning
Growth and profitability are the main corporate goals, and both goals are implied in the original BCG model. The main benefit of having multiple businesses is the opportunity to transfer money from those with high profits but little room for expansion to those with prospects for steady future expansion and profitability.
This results in a portfolio management that is integrated and produces a greater whole than the sum of its parts. Resource allocation must be centralized and planned to establish a balanced portfolio in terms of cash creation and uses in order to achieve these synergistic results.
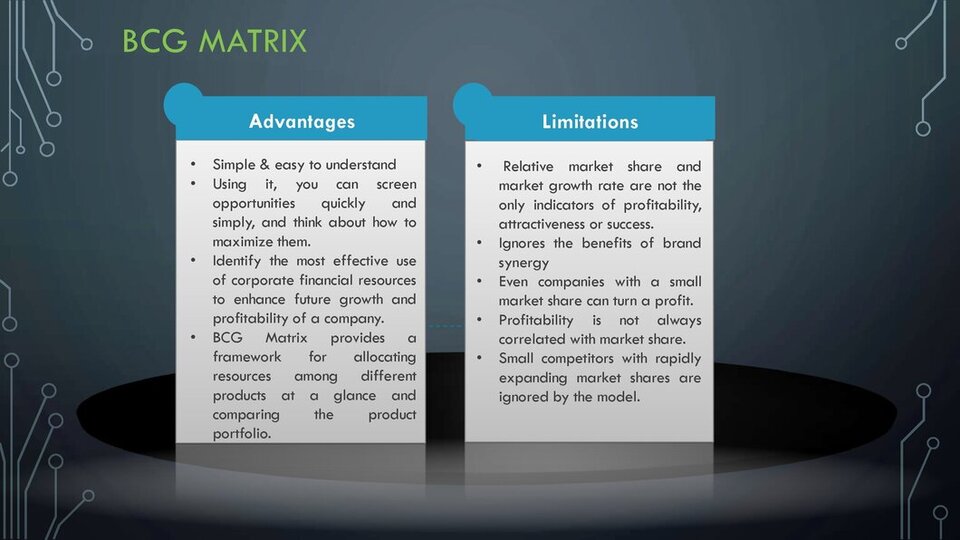
Advantages & Limitations of BCG matrix
The main goal of the growth-share matrix is to examine a portfolio from a corporate standpoint. Only at that point is the cash balance significant. However, a company may be further divided utilizing this diagnostic tool in order to comprehend the various market positions held by each of its unique product lines.
Final Thoughts
When all of these elements are considered, a BCG Matrix path from start-up to market leader can be drawn. Cash Cow investments are designed to be used to pay for Question Marks and Stars. Additionally, Dogs should be sold or liquidated to free up money with little future value.
To ensure future positive cash flows, you will ultimately require a balanced portfolio of Question Marks, Stars, and Cash Cows. You might want to read more about the Ansoff Matrix if you want to learn more about HOW to use these investments to expand a business unit.
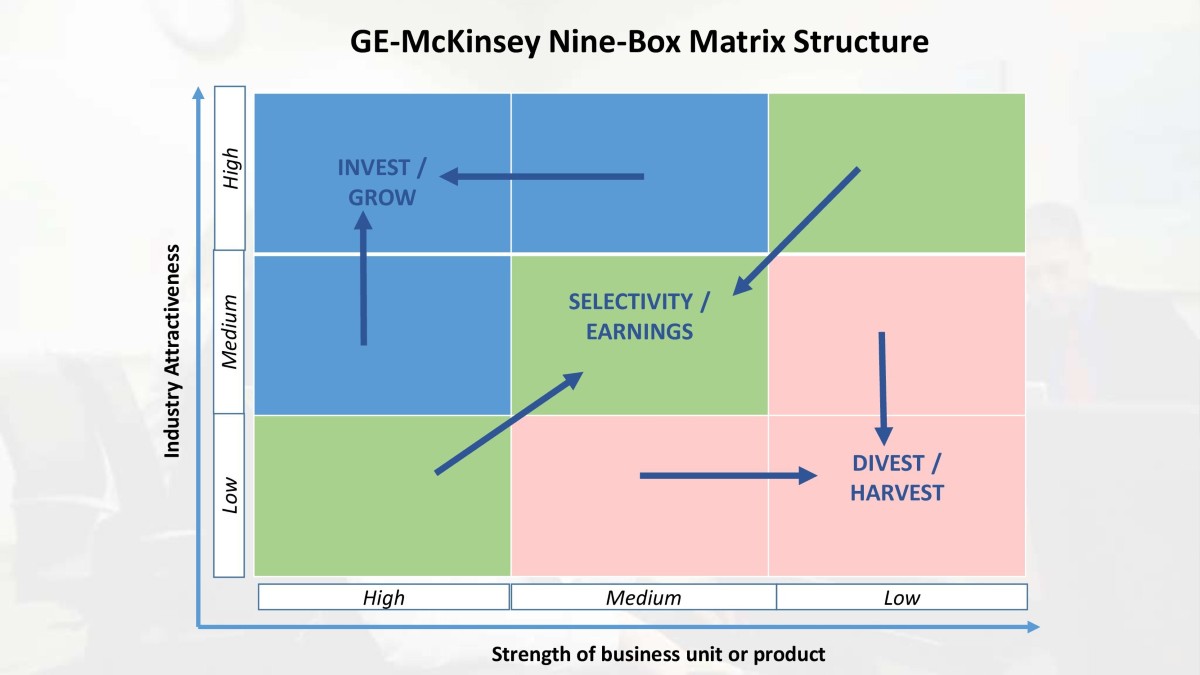
Furthermore, you might want to look into other financial planning frameworks, such as the GE McKinsey Nine Box Matrix.