
It’s easier to control your pay expenses if you have a solid pay structure in place.
In our current market, existing employees and also the potential hires are more informed about the market rate of their position’s salary. They weigh their decision based on salary, benefits, location, commute time, education programs, and opportunities for advancement through easily accessible online data sources. To be effective, compensation must be perceived by employees as fair, competitive in the market, accurately based, motivating, and easy to understand.
HR professionals might create the pay structure for their organization, or they might work with an external compensation consultant. There are several steps to designing a pay structure; articulating and establishing a compensation philosophy, job analysis; job evaluation; pay survey analysis; pay policy development; and pay structure formation.
According to Payscale Compensation Best Practices Report, 44% of companies aim to provide pay raises of more than 3% in 2022.
PayScale
| Table of contents |
| Step 1: Establishing compensation philosophy |
| Step 2: Conduct a thorough job analysis & identify benchmark jobs |
| Step 3: Measuring market position through job evaluation |
| Step 4: Pay policy identification |
| Step 5: Compensation survey analysis |
| Step 6: Developing a pay structure |
| Defining pay ranges |
| Conclusion |
Establishing compensation philosophy

A compensation philosophy sets the tone for how you make pay decisions.
The compensation philosophy is the bedrock of how organizations reward the talent required to achieve business objectives. It provides guidance on where a company aspires to anchor its pay within a comparator group and what compensation elements will be covered.
A well-articulated compensation policy provides valuable guidance for the development of a salary structure. In large organizations, there is often a corporate policy that forms the basis for local policies. A key aspect of an organization’s Compensation Philosophy is a defined pay market where the company wishes to play in rewarding its employees.
Conduct thorough Job Analysis & identify benchmark jobs

The procedure entails establishing a benchmark against which a job can be compared or evaluated.
Job Analysis is a process to identify and determine in detail the particular job duties and requirements and the relative importance of these duties for a given job. While Job Analysis data may be collected from incumbents through interviews or questionnaires, the product of the analysis is a description or specifications of the job, not a description of the person.
The outcome of this process is a job description that includes the job title, a summary of the job tasks, a list of the essential tasks and responsibilities, and a description of the work context. Each job description includes the job title; a job summary; essential job tasks; the job’s work context; and job-relevant knowledge and skills that an incumbent must possess. Understand what tasks, duties, and responsibilities various jobs will entail before assigning fair and competitive pay rates.
Now let’s take an example which we will refer to at each step. You are asked to design the pay structure for a new consulting firm which would comprise of following employees.
- Principal
- Associates (7)
- HR Director (1)
- Payroll Assistant (1)
- Architect Consultants (2)
- Recruiters (3)
- Front desk receptionist (1)
- Admin Assistants (2)
- Analytics Manager (1)
- Information System Analyst (2)
Once the job analysis is done, the job description of each of these positions will help to understand the role and job families of the positions. In this case, we can categorize the above positions in the below job family categories.
Job Family Categorization
| Business & Operation | Office Support | HR |
| Principal | Front desk receptionist * | HR Director |
| Associates * | Admin Assistant | Recruiters * |
| Architect Consultants | Payroll Assistants * | |
| Analytics Manager * |
When data is uncontrolled, women still make $0.82 for every $1 earned by males, according to Payscale’s salary statistics, implying that women make less overall than men when comparing median pay for all women to median pay for all men.
PayScale
Measuring market position through Job Evaluation

A systematic comparison of jobs to determine their relative merit in order to establish a fair pay structure.
Job evaluation is the process of analyzing and assessing various jobs systematically to ascertain their relative worth in an organization. It attempts to make a methodical comparison between jobs to assess their relative worth for the purpose of establishing a rational pay structure. The outcome of job evaluation is the development of an internal structure or hierarchical ranking of jobs. There are three methods of job-based evaluation.
- Point method (which is the most commonly used)
- Ranking method
- Job classification
Job evaluation helps to ensure that pay is internally aligned and perceived to be fair by employees.
To design a pay structure, there must be a formal way to value the work inside the organization so that pay is awarded fairly. The job evaluation process will help develop this internal work hierarchy.
Different evaluation methods, pay strategies, and pay structures will be used for different job families in the organization. A job-based evaluation approach for the business, office support, and HR job families, a skills-based approach will be used for information systems and Analytics job families. The Principal jobs will be assigned pay rates primarily using market pricing and slotted later into the pay structure.
Let us use the point method for job evaluation for business, HR, and office support job families because it is the most commonly used job evaluation method. Next, the compensable factors, degrees, and weights of each factor must be determined. Compensable factors are the factors that establish how the jobs compare to one another, and that determines the pay for each job. Typically, the compensable factors include the major categories of Skills, Efforts, Responsibility, and Working Conditions. Each factor is then divided into levels or degrees which are then assigned points. Each job is rated using the job evaluation instrument. The points for each factor are summed to form a total point score for the job. An example of how this point scheme is applied to the Associate benchmark job.
| Compensable Factors | Degree (Scale: 1-4) | Weight | Points |
|---|---|---|---|
| Skills (50%) | |||
| Education | 2 | 25% | 50 |
| Experience | 1 | 25% | 25 |
| Responsibility (20%) | |||
| Scope of control | 1 | 5% | 5 |
| Impact of job | 2 | 15% | 30 |
| Efforts (20%) | |||
| Degree of problem-solving | 2 | 15% | 30 |
| Task complexity | 1 | 5% | 5 |
| Working Conditions (10%) | |||
| Location | 1 | 5% | 5 |
| Extremes in environment | 1 | 5% | 5 |
| Total Points | 155 | ||
Similarly, we can calculate the job evaluation points for the remaining benchmark jobs using the established compensable factors and specified weights.
Pay Policy Identification

Guarantees a system of fair pay for everyone, and that’s also in alignment with company strategy and objectives.
After determining the job evaluation points for the remaining benchmark positions, the top management along with HR discuss a pay level strategy for each job family. The decision can be that the organization will pay 5 percent above the market in base pay for the HR, business, and office support job families. The group realizes that this lead pay policy will help meet the firm’s customer-focus business strategy by attracting and retaining high-potential employees without incurring labor costs too far above their competitors.
The HR will also provide insights with regards to the benefit-cost. The top management after reviewing the analysis decides to proceed with benefits of 20 percent of the total compensation. Once the pay structure is finalized, the organization can set benefits at a similar ratio of total compensation to achieve a matching benefits policy.
Compensation Survey Analysis

Calculates the median or average pay for employees in one or more jobs.
Compensation survey analysis is the process of analyzing compensation data gathered from other employers in a survey of the relevant labor market. HR has several options when contemplating salary data sources (Purchase a salary survey from a survey organization such as a consulting company, Commission a customized salary survey through a consulting company, Purchase a salary survey from a trade organization or association, Commission a custom survey). Most robust surveys allow for multiple cuts based on revenue category, industry, and geography.HR professionals should consider Cost, Participants (list of participating organizations), and Recent (Age or Trend of the data, if necessary) when determining the quality of the survey.
Most surveys report a variety of data points for use in market analyses. The 50th percentile, also known as the “median,” is the most commonly provided percentile statistic. The survey may also provide the 10th, 25th, 75th, and 90th percentiles. These percentiles should, at the very least, be available for base compensation and total cash compensation, which is base + variable pay (bonus or incentive). For the results of a survey to be valid, the market pay data must be from the relevant labor market for each benchmark job. Outliers should be eliminated because they would not be representative of the sample. Weighted means of base pay should be calculated for each benchmark job from the survey data. For example:
| Name | Mean | No. of employees | Mean X No. of employees |
|---|---|---|---|
| Company A | 50000 | 10 | 500000 |
| Company B | 30000 | 50 | 1500000 |
| Company C | 60000 | 5 | 300000 |
| Total | 65 | 2300000 |
Developing a Pay Structure

Based on market data and the company’s compensation policy, developing a pay structure entails analyzing positions and determining associated salary ranges and grades.
Pay structure creation is the final step, in which the internal structure is merged with the external market pay rates in a simple regression to develop a market pay line. The organization’s Pay Policy decides whether the organization wants to lead, lag or meet the market, the market pay line will be adjusted up or down. To complete the pay structure, pay grades and pay ranges are developed.
The next step is to create a regression model from benchmark job data. Pay grades (e.g., Pay Grade 1, Pay Grade 2, Pay Grade 3) represent groups of jobs that are substantially similar for pay purposes. That is, the jobs in one pay grade may have comparable job evaluation points (i.e., ratings on compensable factors) and be of similar value to the firm. All jobs in a pay grade share the same pay range (minimum and maximum pay rates).
| Benchmark Jobs | Internal Salary Grade | Compensable Points |
|---|---|---|
| Job 1 | 6 | 245 |
| Job 2 | 3 | 155 |
| Job 3 | 6 | 220 |
| Job 4 | 2 | 125 |
| Job 5 | 4 | 170 |
| Job 6 | 2 | 130 |
| Job 7 | 1 | 105 |
| Job 8 | 1 | 110 |
| Job 9 | 5 | 190 |
| Job 10 | 3 | 150 |
Now match the external (survey-based) jobs with the Internal Job (Job Evaluation).
| External Job ID | Internal Salary Grade | Market Median Salary (50th percentile) |
|---|---|---|
| 100 | 1 | 23567 |
| 101 | 1 | 25329 |
| 102 | 2 | 27645 |
| 103 | 2 | 29850 |
| 104 | 3 | 35385 |
| 105 | 3 | 38673 |
| 106 | 4 | 45789 |
| 107 | 5 | 52894 |
| 108 | 6 | 63629 |
| 109 | 6 | 57932 |
Each job is mapped to an internal salary grade. Deep expertise and knowledge would be required to map the External job ID to Internal grades. In the above example, the mapping has been done using the 50th percentile (Median) but it can also be done with the 40th or 75th percentile based on the pay policy identification by the leadership team and the level of competitiveness they want to have for the organization.
Next, create a regression model from the benchmark job data. Regression creates a “line of best fit” by merging the job evaluation points (X) and the external salary data (Y). The resulting regression line is used to predict the base pay (Y) for a specific number of job evaluation points (X). The equation for the simple regression line (as it is for any line) can be represented as:
y=mx+b; in which:
y =the predicted base pay
m =the slope of the line
x =the job evaluation points
b =the y-intercept
Knowledge of Excel (using scatter chart) and basic regression modeling would be helpful in creating the above view. Each of the dots represents the market data. The regression output shows information about how well the regression line fits the data. Generally, the R squared referred to as variance explained, should be .95 or higher.
If R squared is significantly lower than this, there may be problems stemming from the job evaluation step. For example, the points assigned to certain benchmark jobs may be off – i.e., not make sense given the level of tasks, duties, and responsibilities required for the job and the knowledge, skills, and abilities needed by the job incumbent. If this is the case, re-examine the job descriptions and reconsider the points assigned to the benchmark jobs. Alternatively, there may be errors in the weighted average calculations. After conducting the regression again, examine the new R squared.
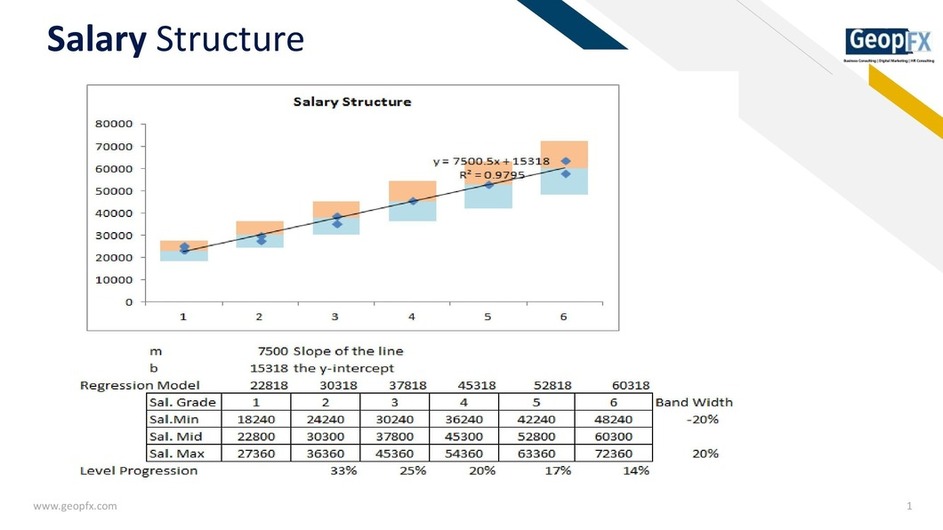
Defining the Pay Ranges
For each of the salary grades, a salary midpoint is calculated using a formula. For example, in the above regression chart, the mid salary of Grade 1 would get calculated as (m * salary grade+ b). In the above chart, it is 22818 which is rounded off in 100’s to 22800(7500*1+15318). Similarly, all the Mid-point salary for each of the salary grades has been calculated.
For arriving at the Max and Min. Salary ranges define the bandwidth based on the input from the job evaluation committee. It can vary for each of the roles (For Front desk receptionist, it can be 10%, for Associates it can be 20%, and so on and so forth). Each pay grade will have a minimum and maximum pay rate.
Conclusion
Finally, adjustments have to be applied based on Market data adjustments, survey selections, job selections, percentile selections, Bandwidth, Regression model selection, Compa Ratio, Market competitiveness, Legislative requirements, Budget, and Business/Strategy considerations to freeze on the agreed pay structure. Strive to achieve a scale that will reflect comp policy and enhance internal cohesion in the organization.
This step is the art of compensation, not the science. Review the proposed scale with management, presenting rationale, budget, and overall market comparisons. Discuss concerns that may have uncovered specific positions or grades, and educate management about the process used. Outline your implementation plans. Lastly, develop appropriate communications for managers and staff. Let them know how the organization compares to the market and put a positive spin.
GeopFX is a consulting firm that specializes in offering small and medium-sized businesses cost-effective and scalable workforce solutions. We collaborate with our clients to create the best organizational structures, roles, and responsibilities possible.