An investment prioritization framework developed by GE-McKinsey that enables multi-business corporations to prioritize their investments.
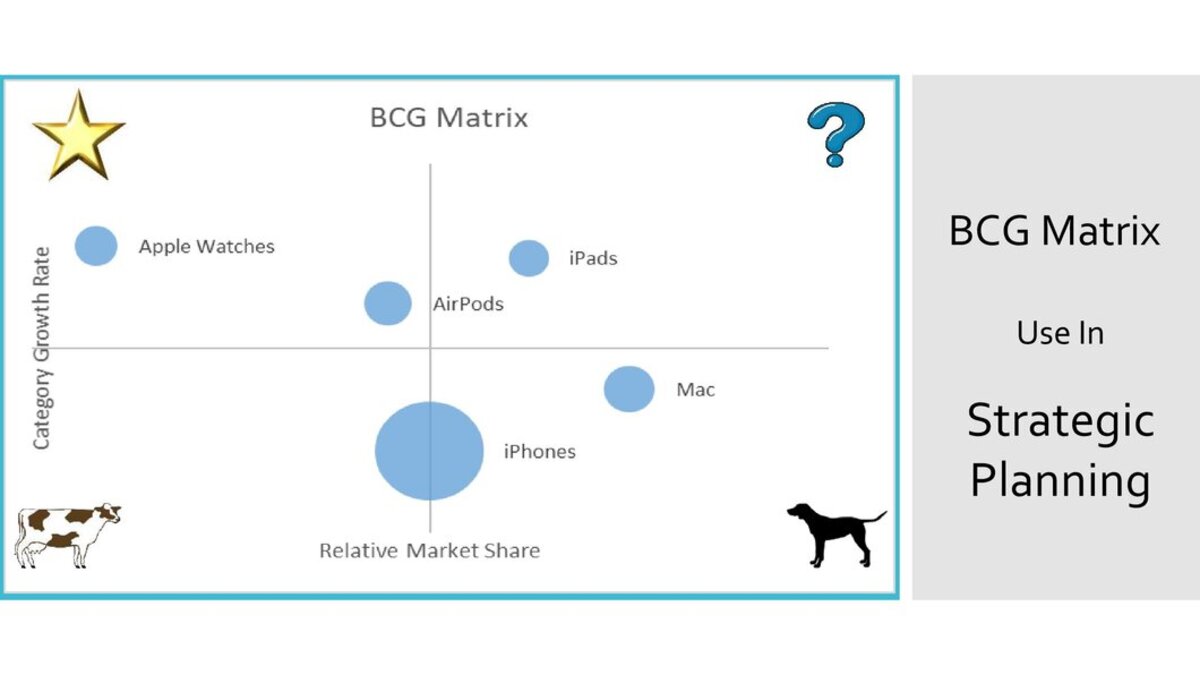
The GE matrix helps organizations decide how to approach different product lines, i.e., which product to add to their current offering and which opportunity to pursue, similarly to the BCG matrix. GE’s matrix and the BCG matrix are both two-dimensional models used by large corporations with many product lines. The GE-McKinsey matrix overcame several shortcomings because it was created as an improvement on the BCG one.
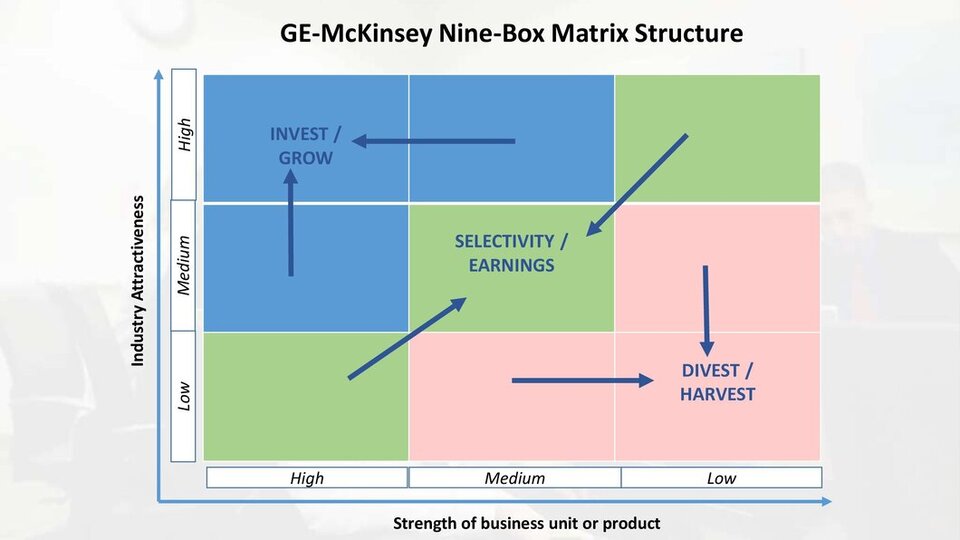
Explaining nine-box matrix
It provides a systematic way for decentralized corporations to decide where they should invest their cash. The corporation can evaluate a unit based on two variables that will determine whether it will succeed in the future rather than relying just on each business unit’s forecasts of its prospects: the industry attractiveness of the relevant industry and the unit’s competitive strength within that market.
A variety of portfolio models, such as Market Activated Corporate Strategy (MACS) and the portfolio of initiatives, have their roots in the nine-box matrix. Businesses must decide how to use their capital effectively given the issue of resource scarcity and optimization.
Teams, functional departments, divisions, and business units compete for investments at every level of the organization. Further, for those who allocate the resources, deciding where and how much to invest is a constant cause of conflict.
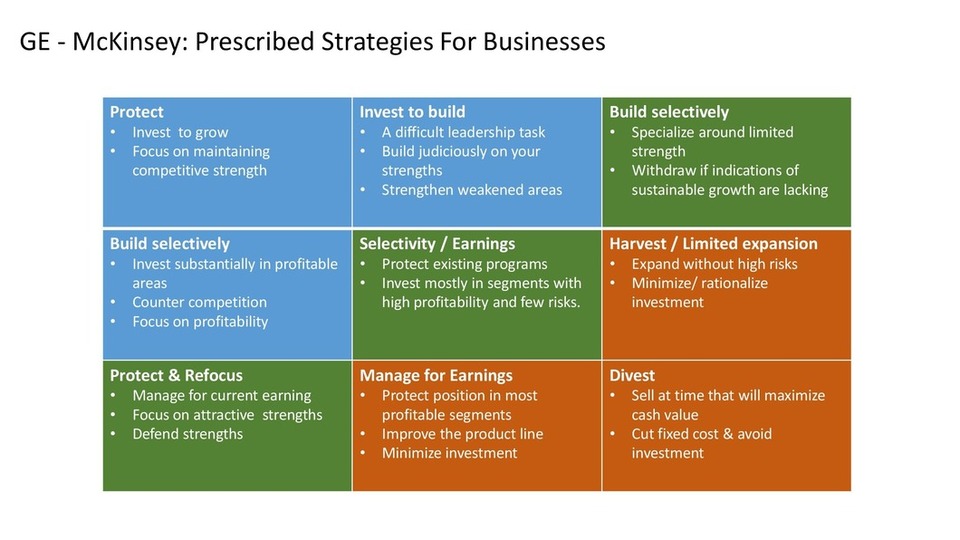
Using the tool, the company can decide which products or services it should invest in by comparing the business units and assigning them to the groups that are worth investing in or harvesting or divesting.
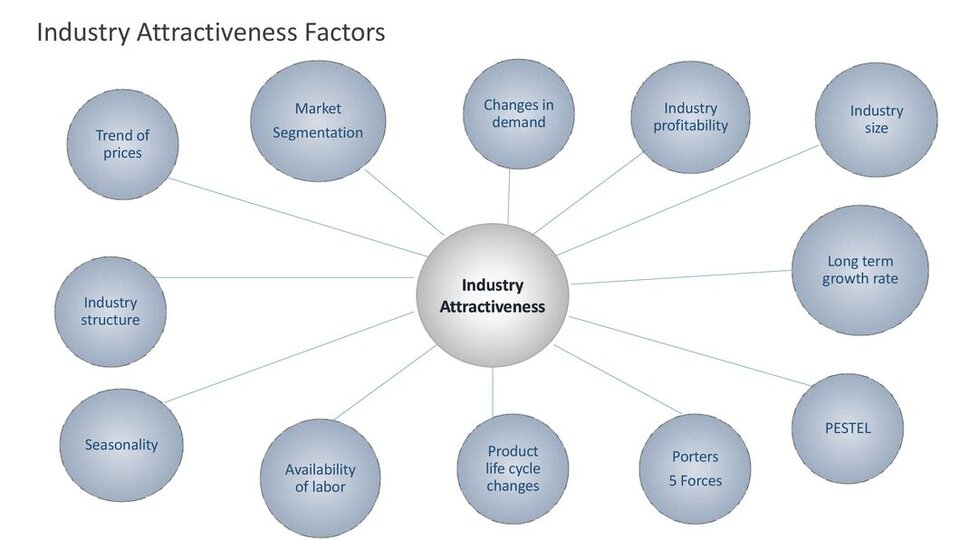
Industry Attractiveness
A company’s ability to compete in the market and earn profits depends on how attractive the industry is and an industry’s attractiveness increases with its profitability. When assessing the attractiveness of an industry, analysts should look at long-term trends rather than short-term.
The most typical list of variables used to determine the level of competition in an industry’s attractiveness are:
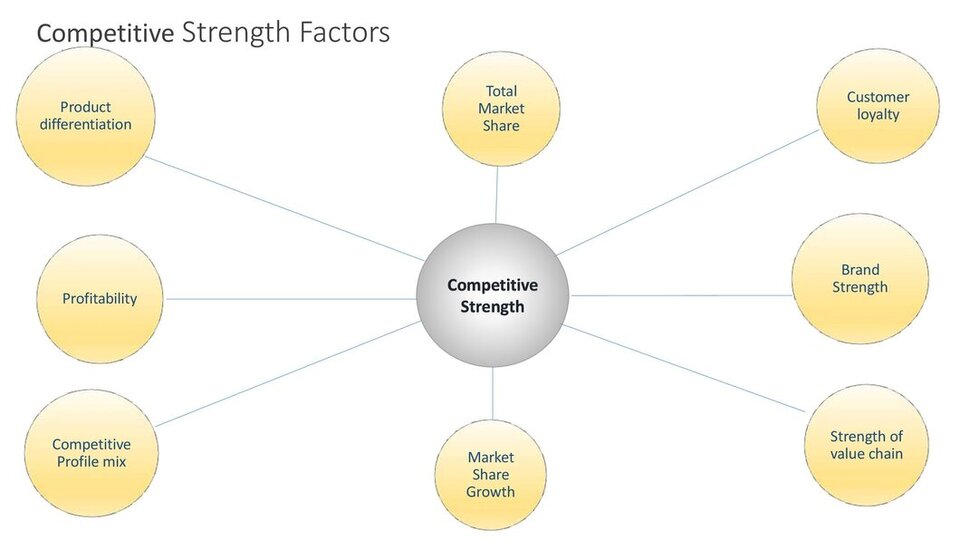
Competitive strength of a business unit or product
The matrix measures a business unit’s competitive strength against its competitors. The following variables impact how competitively strong a business unit is:
Steps to use the GE-McKinsey Matrix intelligently
The framework is self-explanatory by itself, and managers cannot undertake the analysis using any tried-and-true procedures or models. However, carrying out the necessary processes to precisely fill in the nine boxes and create a superior decision-making tool unquestionably involves statistical or mathematical expertise.
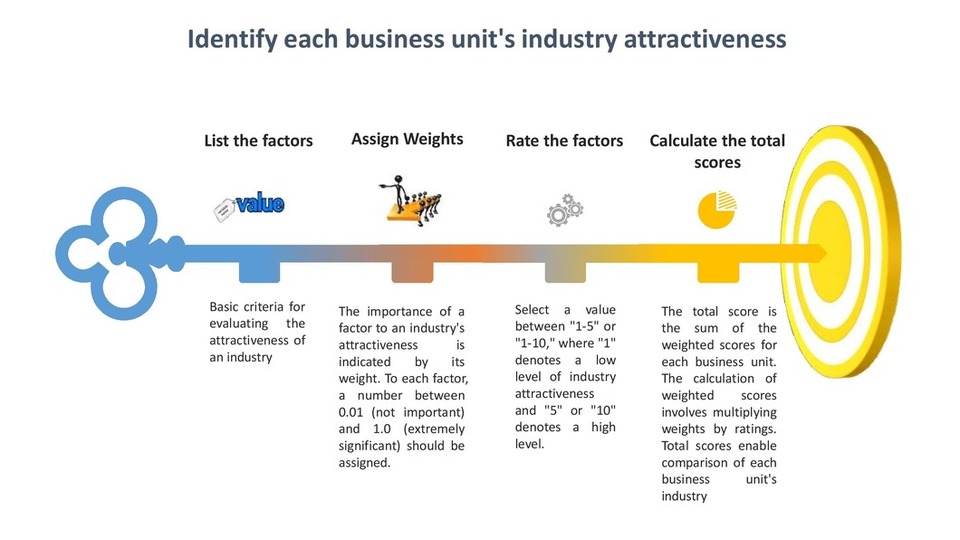
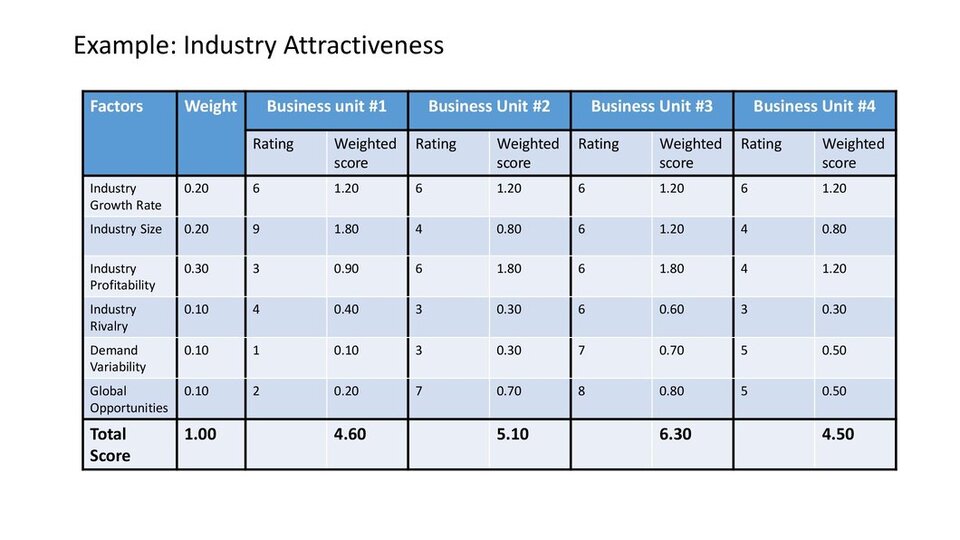
Step #1: Identify each business unit’s industry attractiveness
This is a difficult task that typically calls for consulting with a specialist in the relevant sectors. To ensure the analysis is as precise as possible, the consultant will assist you in choosing the weights and rating them appropriately.
Let’s look at an example and understand the steps clearly.
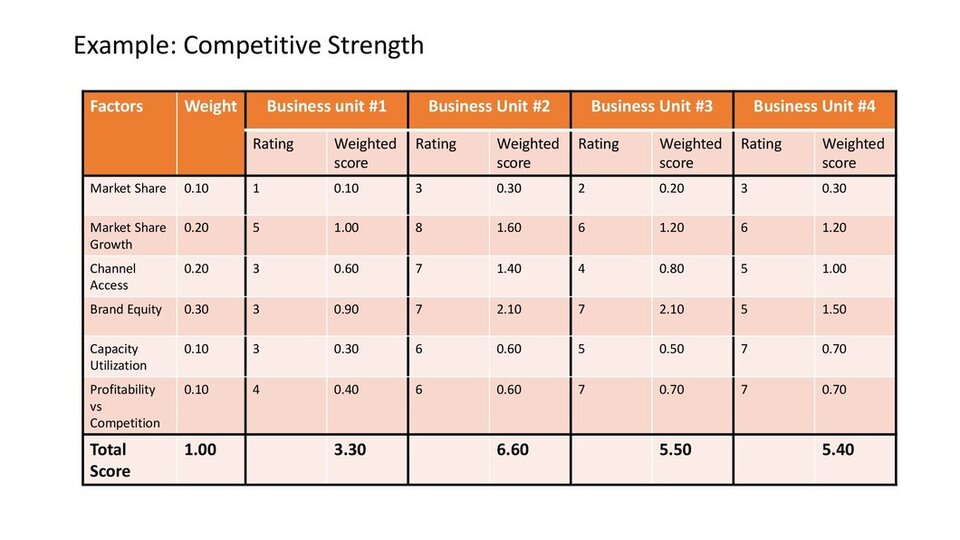
Step #2: Discover each business unit’s level of competitive strength
Step 2 is similar to Step 1. Only this time, a business unit’s competitive power is assessed rather than the attractiveness of the industry.
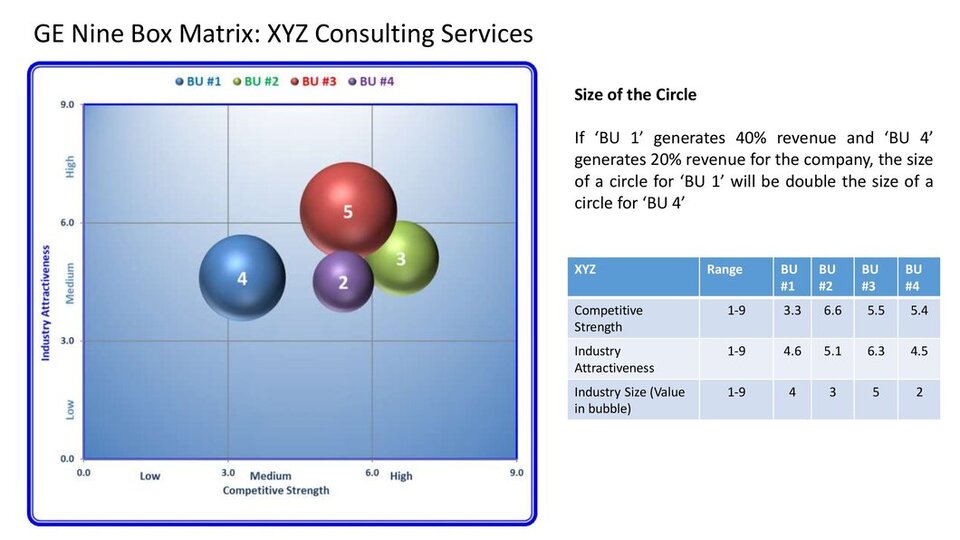
Step #3: Draw a matrix with the business units in it
We may plot the business units on the matrix once we have all the assessments and scores in place. A circle is used to represent each company unit. The proportion of the business revenue produced by that business unit should be represented by the size of the circle.
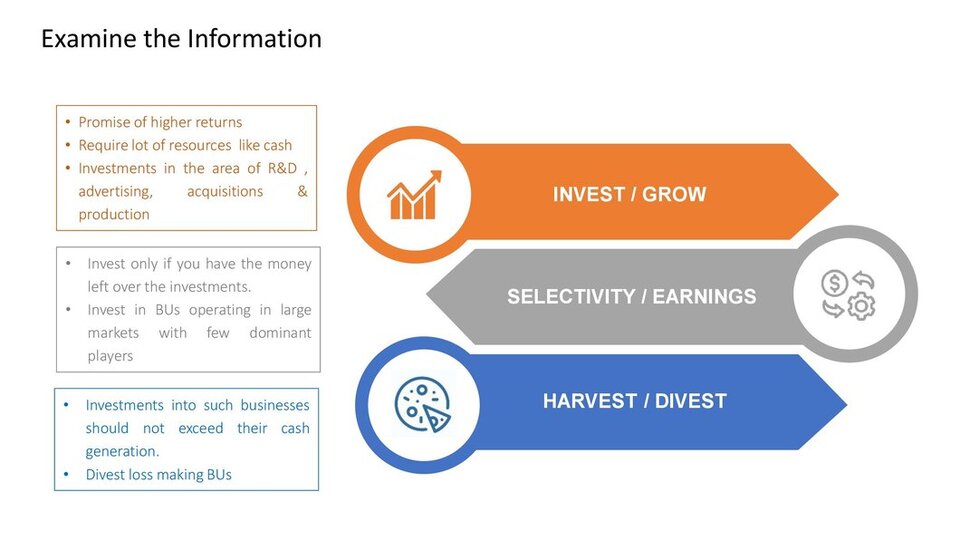
Step #4: Examine the information
Depending on the boxes your company units have been plotted in, there are different investment implications you should follow. Investment/grow, selectivity/earnings, and harvest/divest boxes are the three categories of boxes. What you should do with your investments is indicated for each group of boxes.
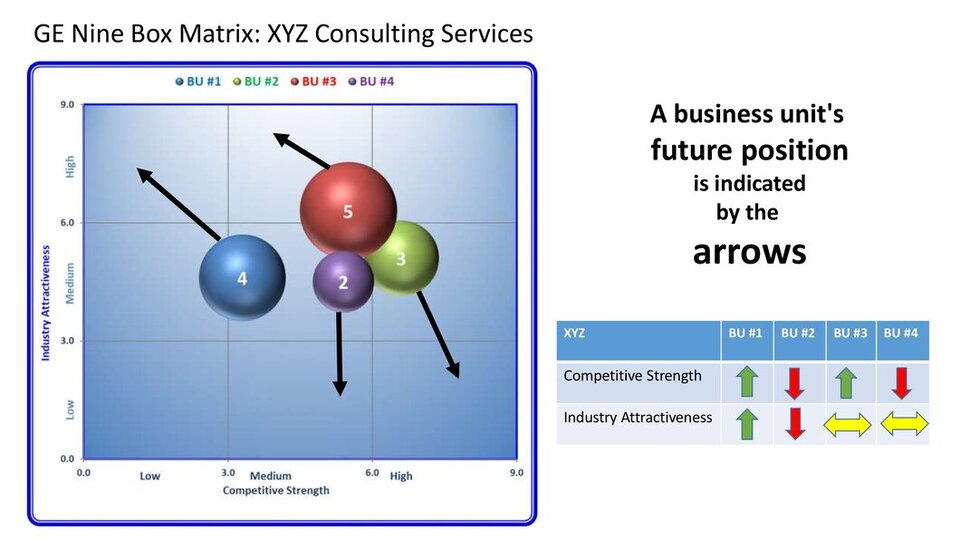
Step #5: Determine each BU’s future course
There is no consideration of how industry attractiveness and competitive strength may change in the future according to the GE McKinsey matrix. Analysis may reveal that investing in some of the business units can significantly improve their competitive positions or that the industry is likely to grow significantly.
In order to evaluate whether the industry’s attractiveness will increase, diminish, or remain the same in the future, the company should speak with industry analysts.
How likely is it that the competitive strength of your business unit will rise or fall over the next few years? Once all the data has been gathered, the arrows are added to the circles in current matrix. The arrows indicate where a business unit will be in the future.
The following table displays the projected changes in business unit competitive strength and industry attractiveness over the next two years.
Step #6: Set priorities for your investments
Choosing where and how to invest the company’s money is the final phase. Even though the matrix makes things simpler by assessing the business divisions and determining which ones to invest in, it still doesn’t provide answers to several crucial queries:
- Does it truly make sense to invest in certain business units?
- How much money should you really invest?
- Where should business units make investments (more in R&D, marketing, or the value chain?) to boost performance?
GE-McKinsey Matrix example
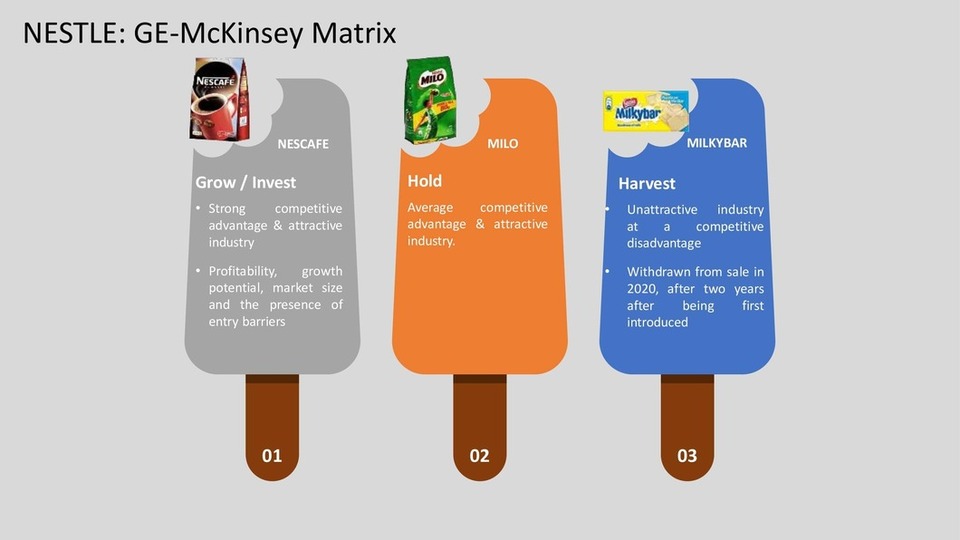
Nestlé is a global company that manufactures baby food, bottled water, powdered drinks, cereals, coffee, drinks, and pet care products. The company sells goods such as infant food, bottled water, breakfast cereals, pet food, snacks, coffee, healthcare nutrition, and confectionery. It also owns 29 brands with annual sales of at least $1 billion and more than 2,000 brands altogether.
We believe Nestle makes a great candidate for a GE-McKinsey matrix study given its thousands of brands across numerous markets and industries.
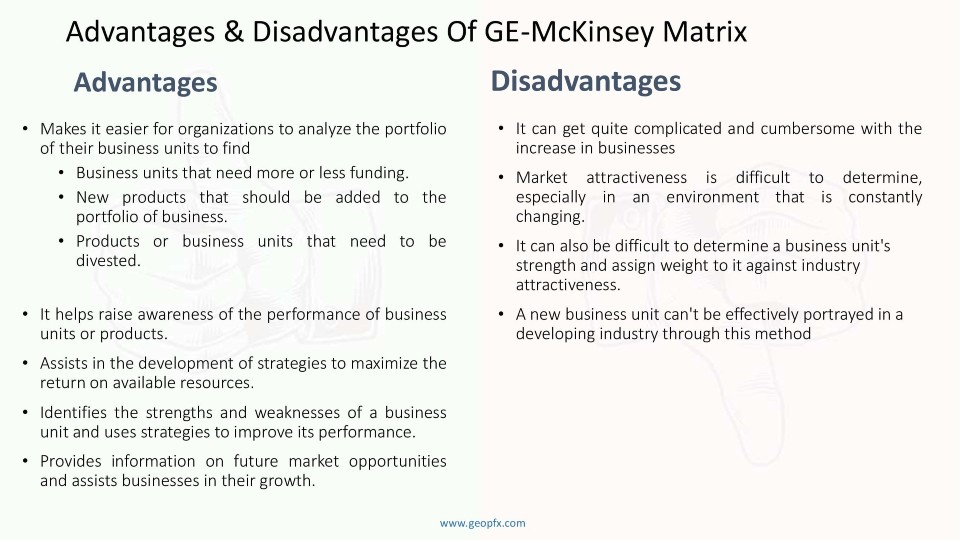
Advantage & Disadvantages of GE-McKinsey Matrix
Final Thoughts
To determine the order of priority for investments throughout your organization, use the GE-McKinsey Matrix. By assessing a business unit’s market power and industry attractiveness, you can quickly establish how well-positioned it is for growth and potential. It is probably worthwhile to continue investing in the business unit if it has a strong position in either one of these dimensions or both.
You may get a great picture of your strategic business units or other company segments via the GE Matrix. In order to maximize your market position and spend your resources as effectively as possible, you can next begin a thorough analysis of the precise plan to pursue.