Understanding networks, which are frequently also referred to as graphs, requires the use of centrality measures. Centrality measures address the question:
“Who is the most important or central person in this network?”

“There is certainly no unanimity on exactly what network centrality is or on its conceptual foundations, and there is little agreement on the proper procedure for its measurement.”
Freeman
To determine the significance of any specific node in a network, these techniques make use of graph theory. They show areas of the network that require attention by cutting through noisy data, although they all operate in various ways. Finding the optimal measure for your graph visualization applications requires an understanding of how each measure functions because each has a different notion of “importance.”
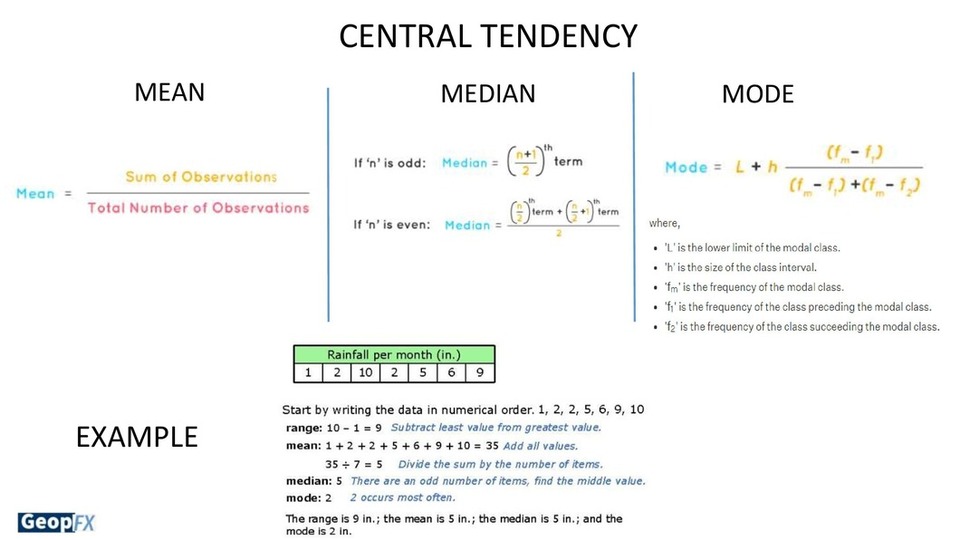
Measures of central tendency
In statistics, a measure of central tendency is a single value that describes the central position of a set of data. As a result, measures of central location are occasionally used to refer to measures of central tendency.
The mean, median, and mode are all reliable indicators of central tendency, however depending on the situation, some indicators are more useful than others.
Let’s examine the mean, mode, and median and learn how to calculate them as well as when it is best to utilize them.
Network Centrality Measures: How Correlated Are They?
All centrality measures are derived from the adjacency matrix, and as a result, they all represent various mathematical computations on the same underlying data. The establishment of several measures may be rather redundant if the variables are closely connected, and we may anticipate that the various variables will act similarly in statistical studies. If the measures are not significantly connected, on the other hand, they suggest distinctive measures that are probably associated with various outcomes.
Let us look at a simple example
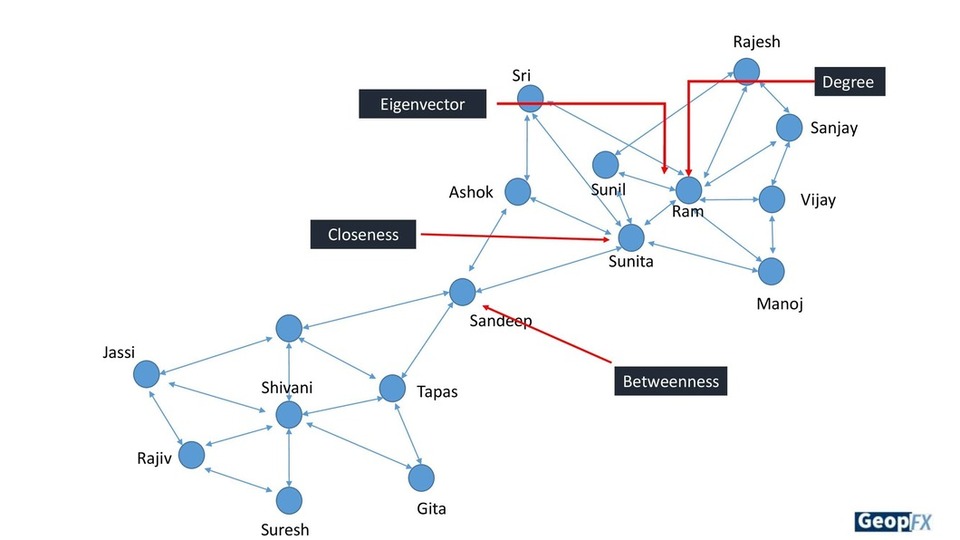
There are measurements in a similar way when we discuss centrality in a network. The number of connections each actor has determines their degree of centrality. Ram thus has more connections than any other node in the network shown below. This is equivalent to mode what is the most frequent number.
Sunita, on the other hand, has fewer connections than Ram, but if you were to calculate the average distance between Sunita and every other node in the network, the fact that Sunita is located one step close to another cluster of the network means that she has a shorter average distance than Ram. So she is higher in closeness this is equivalent to the mean or average because we’re talking about the average distance.
Sandeep serves as a connecting link between the two clusters you can see on the network, making him central. This measures how frequently a node takes the shortest or intermediate route between various network actors. Due to its location in the middle of a path, that would be comparable to the median.
Eigenvector is a measure of the extent to which a node is connected to influential others. Eigenvector Centrality is an algorithm that measures the transitive influence of nodes. A node’s score is increased more by connections coming from high-scoring nodes than by connections coming from nodes with low scores. A node that has a high eigenvector score is linked to numerous other nodes that also have high scores.
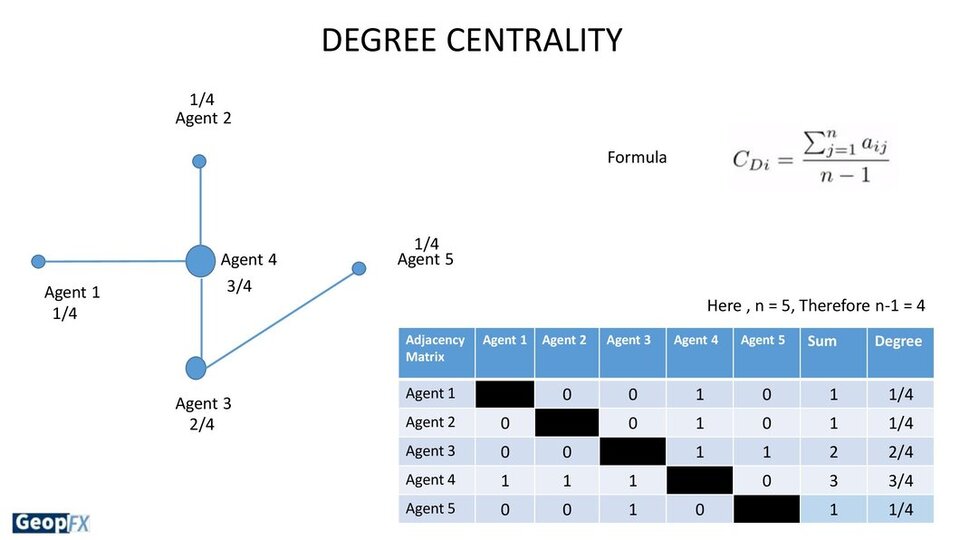
Degree Centrality
Definition
The number of links each node holds determines the important score that is assigned by degree centrality.
What it conveys
How many direct, ‘one hop’ connections each node has to other nodes in the network.
And when to use it
For locating people who are well-connected, well-liked, likely to hold the most knowledge, or who can easily connect with the larger network.
Details
The simplest way to determine node connection is through degree centrality. When examining transactional data or account activity, for instance, it can be helpful to compare in-degree (number of inbound links) and out-degree (number of outward links) as separate metrics.
Closeness Centrality
Definition
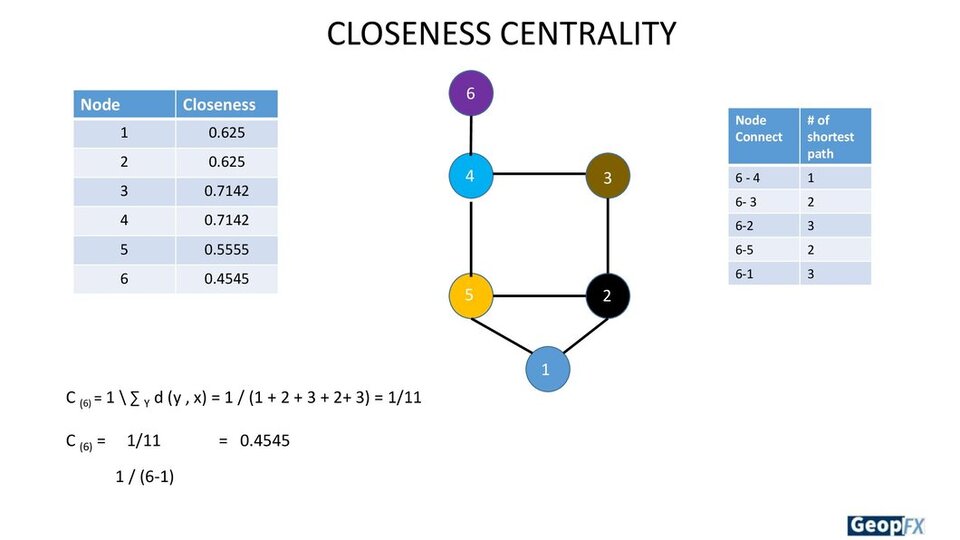
Each node is given a score based on how “close” they are to all other nodes in the network.
What it conveys
The shortest pathways connecting each node are determined using this metric, and each node is then given a score based on the sum of its shortest paths.
And when to use it
For identifying the people most suited to quickly affect the entire network.
Details
Although closeness centrality might be useful for identifying effective “broadcasters,” you will frequently discover that all nodes in a highly connected network have a similar score. Finding influencers in a single cluster using Closeness may be more beneficial.
Betweenness Centrality
Definition
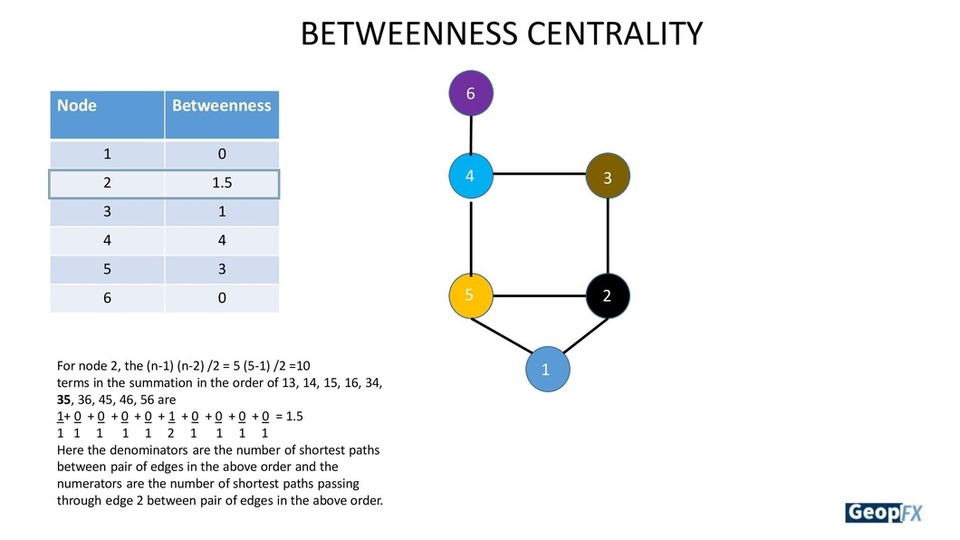
Betweenness centrality measures the number of times a node lies on the shortest path between other nodes.
What it conveys
This measure identifies the network nodes that act as “bridges” between other nodes. It accomplishes this by counting how many times each node is on each of the shortest paths after first identifying them.
And when to use it
For identifying the people who have an impact the flow around a system.
Details
Betweenness is helpful for examining the dynamics of communication. A person may have power over different clusters in a network if they have a high betweenness count, or they may simply be on the fringes of both clusters.
Eigenvector Centrality
Definition
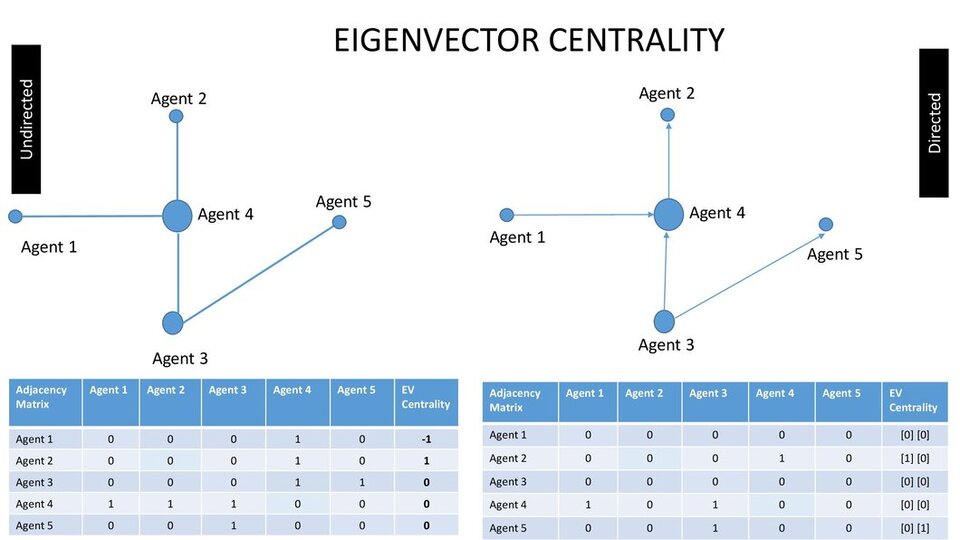
Based on how many linkages a node has to other nodes in the network, Eigen Centrality calculates that node’s influence. Then, Eigen Centrality takes things a step further by accounting for a node’s degree of connectivity, the number of links in its connections, and so on throughout the network.
What it conveys
Eigen Centrality can discover nodes that have influence over the entire network, not just those that are immediately connected to it, by computing a node’s extended connections.
And when to use it
A useful “all-around” SNA score is Eigen Centrality, which is useful for comprehending both human social networks and other networks, such as those involved in the spread of malware.
Details
Eigenvector is a measure of the extent to which a node is connected to influential others. Eigenvector Centrality is an algorithm that measures the transitive influence of nodes. A node’s score is increased more by connections coming from high-scoring nodes than by connections coming from nodes with low scores. A node that has a high eigenvector score is linked to numerous other nodes that also have high scores.
This metric is frequently used by Google’s PageRank to determine suggestions for a website search. It’s a high degree node with the potential to influence directly. It is a node that is correlated with informal power nodes that are high, have the ability to broker resources, knowledge information from one side of the network to the other.
Applications of network Centrality
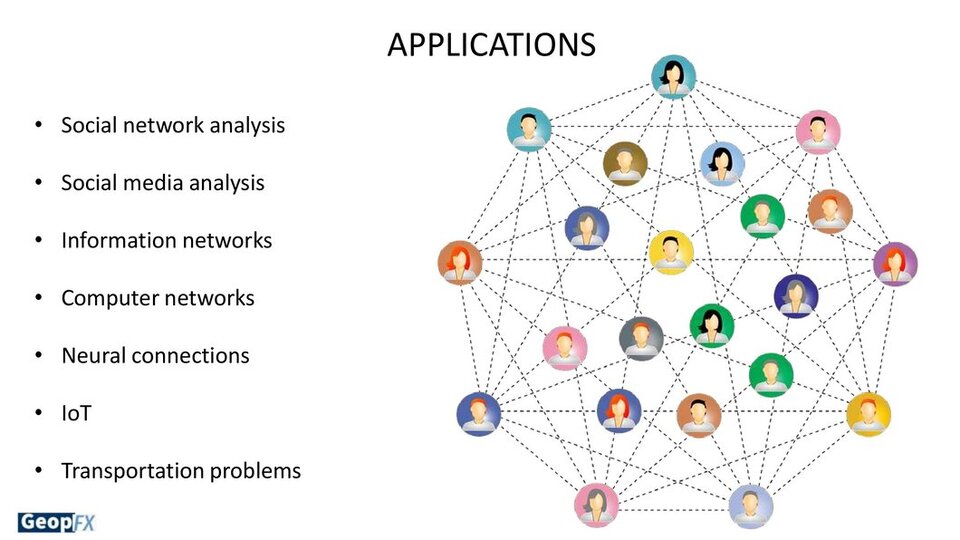
Applications include locating the most powerful individuals in a social network, important Internet or urban network infrastructure nodes, super-disease spreaders, and brain networks.
Final Thoughts
The study of graphs has many practical applications and is a very broad area. This article’s focus was limited to providing an introduction and discussion of centrality, a key network analysis metric. The concept of graph theory is fascinating and exhilarating, but it’s also clear that this is only an introduction to the subject. When evaluating networks, there are numerous key variables to consider, including centrality.


